Post

Ekansh Mittal

@ekanshmittal_kw
2 years ago ~2050 views
There's a common saying in the market - Be fearful when others are Greedy and Greedy when others are fearful

It's a market timing statement, but used very loosely

Ever thought, how to know when Investors are Greedy or Fearful...Let's look at 2 data points

1st - Google Multibagger data chart

This is 1 data we use to understand which zone the market is in or where it is headed

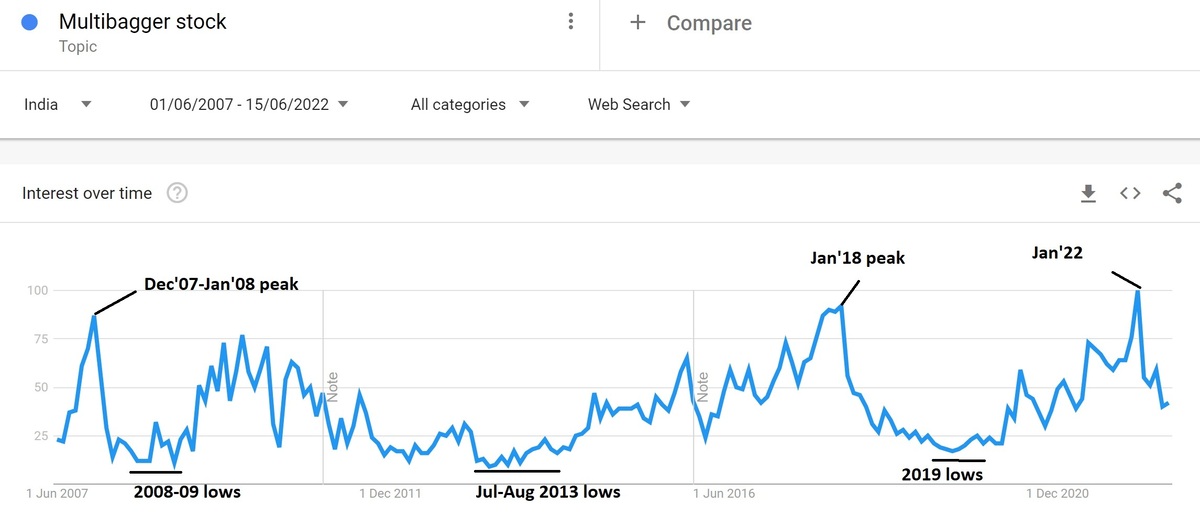
What is it? It's a graph from Google trends for search term ‘Multibagger stocks’
31 Likes
3 Reposts

Ekansh Mittal

@ekanshmittal_kw
2 years ago ~120 views
It depicts investor participation/interest (through google search for term ‘Multibagger Stock’) at various points of time

As the chart indicates, the investor’s interest peaked and bottomed around the same time the markets peaked and bottomed out

Markets topped out in Jan’08, Oct’10, Jan’18 and Jan’22 and even the Google Trends graph (for search term “Multibagger stocks”) topped out in Dec’07, Jan’18 and now in Jan’22

Markets formed a bottom around late 2008, mid 2013, mid 2019 and the Google trends graph also bottomed around Sep’08-Feb’09, Jul-Aug’13, Jul-Aug’19

Just to add here, the above graph is more relevant for Small and Mid cap indices

Currently, the graph is in middle after topping out in Jan'22 indicating Investor's participation has reduced in comparison to few months ago

Though, it could go down further just like 2018-19, 2012-13, 2009, etc


8
0
1

Ekansh Mittal

@ekanshmittal_kw
2 years ago ~130 views
2nd - Equity Turnover Data

Towards the end of the bull run, participation from the new investors increases substantially

As they make instant money on the stocks purchased, their interest in the market increases, they trade more and as a result the turnover increases

However, as the markets correct and the investors who entered the peak of the market start witnessing losses on their investments, they lose interest, stop trading, become long term investors and the turnover goes down

This gets repeated in every cycle

Here’s some data for reference:

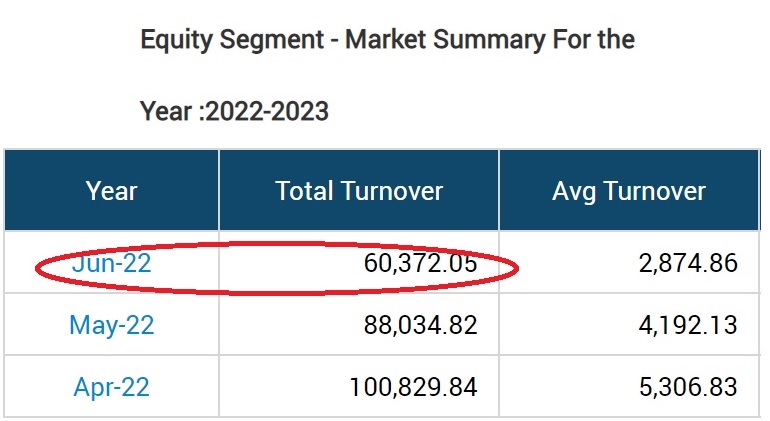
- BSE’s average equity monthly turnover in FY 22 Rs 1.11 lakh crore
- BSE’s equity turnover in Jun’21 Rs 1.50 lakh crore
- BSE’s equity turnover in Jun’22 Rs 0.63 lakh crore


7
0
1

Ekansh Mittal

@ekanshmittal_kw
2 years ago ~100 views
The turnover for Jun'22 is down more than 50% from year ago Jun'21 and down more than 40% from the average monthly turnover in FY 22

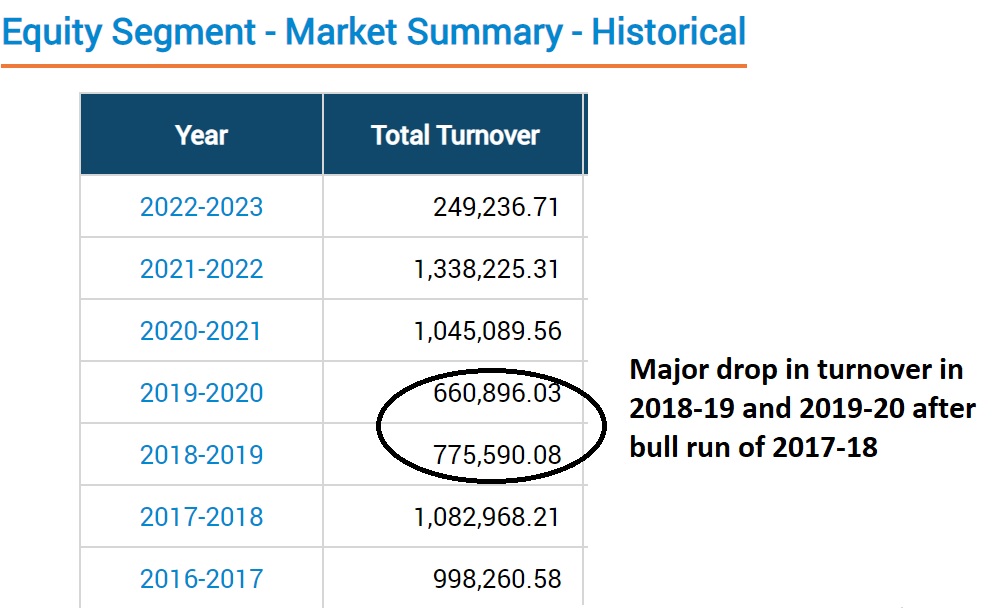
Same story repeated in 2018-19 and 2019-20 after major bull run in 2017-18

Most investors lose interest after major market correction


5
0
1

Ekansh Mittal

@ekanshmittal_kw
2 years ago ~140 views
This is what we mean by quantification of Greed and Fear

Clearly, the investors are not greedy anymore and there’s a sense of Fear in the market and that’s why the oft repeated question ‘Has the market bottomed?’

What can you do as an Investor?

As mentioned above, next 6-12 months look crucial from the view of wealth creation over the next 3-4 years

SIP Investors If you were investing in SIP mode, continue your SIPs and may even consider increasing the quantum, if possible

Lump-sum Investor If you have lump-sum to invest, spend a greater number of hours identifying good stocks at reasonable valuations and stagger your investment over the next 6-12 months

Fully invested If you are fully invested, evaluate your portfolio thoroughly, exit from the stocks where the up cycle may have already played out even if you have to book losses
6
0
1

Ekansh Mittal

@ekanshmittal_kw
2 years ago ~50 views
Identify opportunities which are coming off the lows, turning around or where you think there will be strong earnings growth over the next 3-4 years

Remember, don’t expect immediate run-up in stocks, in fact it’s quite possible that you may buy something reasonably valued today and may later find it 10-20% cheaper
6
0
0

Market Indices

As On